
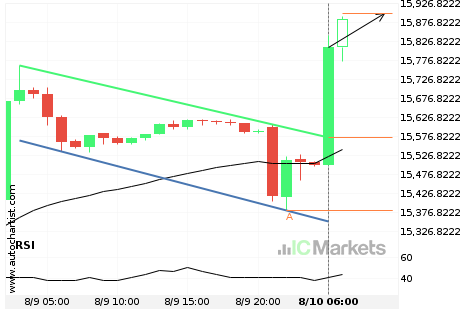
FTSE China A50 Index – resistance line breached
FTSE China A50 Index has broken through the resistance line of a Flag technical chart pattern. Because we have seen it retrace from this position in the past, one should wait for confirmation of the breakout before trading. It has touched this line twice in the last 2 days and suggests a target line to […]
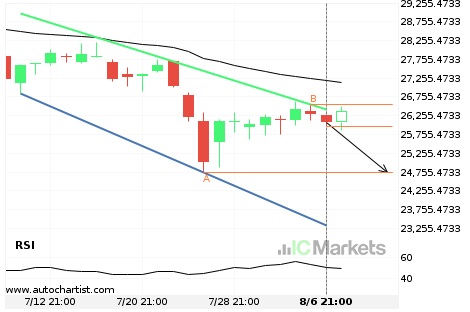
Either a rebound or a breakout imminent on Hong Kong 50 Index
Hong Kong 50 Index is heading towards the support line of a Channel Down. If this movement continues, we expect the price of Hong Kong 50 Index to test 24743.4000 within the next 3 days. But don’t be so quick to trade, it has tested this line numerous times in the past, so this movement […]
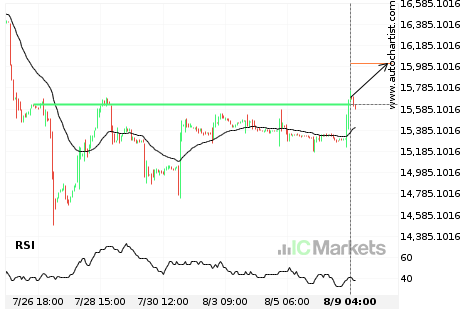
A start of a bullish trend on FTSE China A50 Index
FTSE China A50 Index has broken through a line of 15631.8896. If this breakout holds true, we expect the price of FTSE China A50 Index to test 16010.4092 within the next 2 days. But don’t be so quick to trade, it has tested this line numerous times in the past, so you should probably confirmation […]
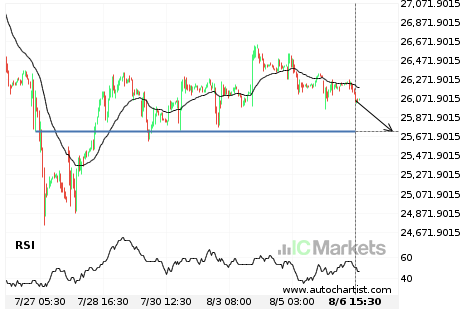
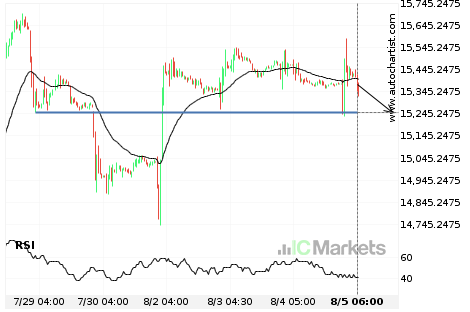
Hong Kong 50 Index approaching important 25724.1992 price line
Hong Kong 50 Index is approaching the support line of a Support. It has touched this line numerous times in the last 11 days. If it tests this line again, it should do so in the next 2 days.

Hong Kong 50 Index approaching important 25724.1992 price line
Hong Kong 50 Index is approaching the support line of a Support. It has touched this line numerous times in the last 11 days. If it tests this line again, it should do so in the next 2 days.
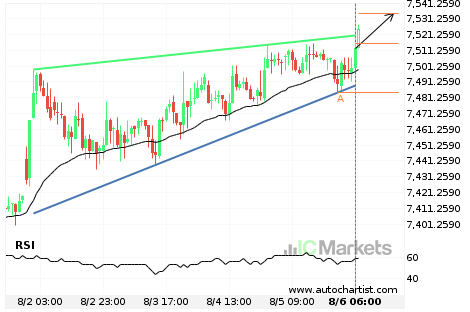
Australia 200 Index – getting close to resistance of a Rising Wedge
Australia 200 Index is moving towards the resistance line of a Rising Wedge. Because we have seen it retrace from this line before, we could see either a break through this line, or a rebound back to current levels. It has touched this line numerous times in the last 5 days and may test it […]
Either a rebound or a breakout imminent on FTSE China A50 Index
FTSE China A50 Index is heading towards a line of 15251.8701. If this movement continues, we expect the price of FTSE China A50 Index to test 15251.8701 within the next 2 days. But don’t be so quick to trade, it has tested this line numerous times in the past, so this movement could be short-lived […]
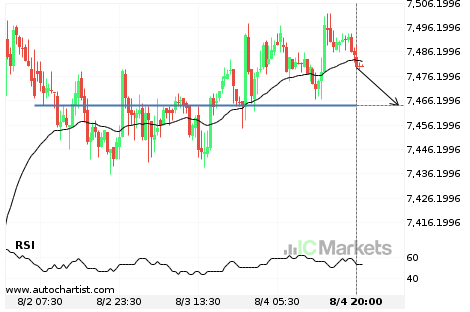
Australia 200 Index approaching important 7464.0601 price line
Australia 200 Index is approaching the support line of a Support. It has touched this line numerous times in the last 3 days. If it tests this line again, it should do so in the next 13 hours.

Australia 200 Index approaching important 7464.0601 price line
Australia 200 Index is approaching the support line of a Support. It has touched this line numerous times in the last 3 days. If it tests this line again, it should do so in the next 13 hours.